Every email verification vendor on the market claims near-perfect accuracy. NeverBounce promises 99.9% deliverability. ZeroBounce advertises 99% accuracy. Snov.io claims 98%. Kickbox, MillionVerifier, Emailable, and a dozen others make near-identical claims. If every tool were as accurate as its homepage says, bounced emails would be a solved problem. Yet the only independent multi-tool benchmark published in this space found that the best-performing verifier scored 70% accuracy under strict measurement, and the worst scored 31%.
That gap between marketing claims and measured reality is the reason this post exists. Vendor accuracy figures are self-reported, tested on undisclosed datasets, using undisclosed definitions of what "accurate" even means. A tool that marks every difficult address as "unknown" can technically claim near-perfect accuracy on the addresses it does classify, while leaving you to guess about a third of your list.
This post gives you two things. First, the 2026 email deliverability benchmarks by industry, drawn from named, published sources, so you know exactly what a good bounce rate looks like for your sector. Second, a full breakdown of the independent benchmark data that actually exists for verification tools, what it measured, where its methodology is strong, where it has a disclosed bias, and what it means for how you should evaluate any verifier, including No2Bounce.
What counts as a good bounce rate in 2026
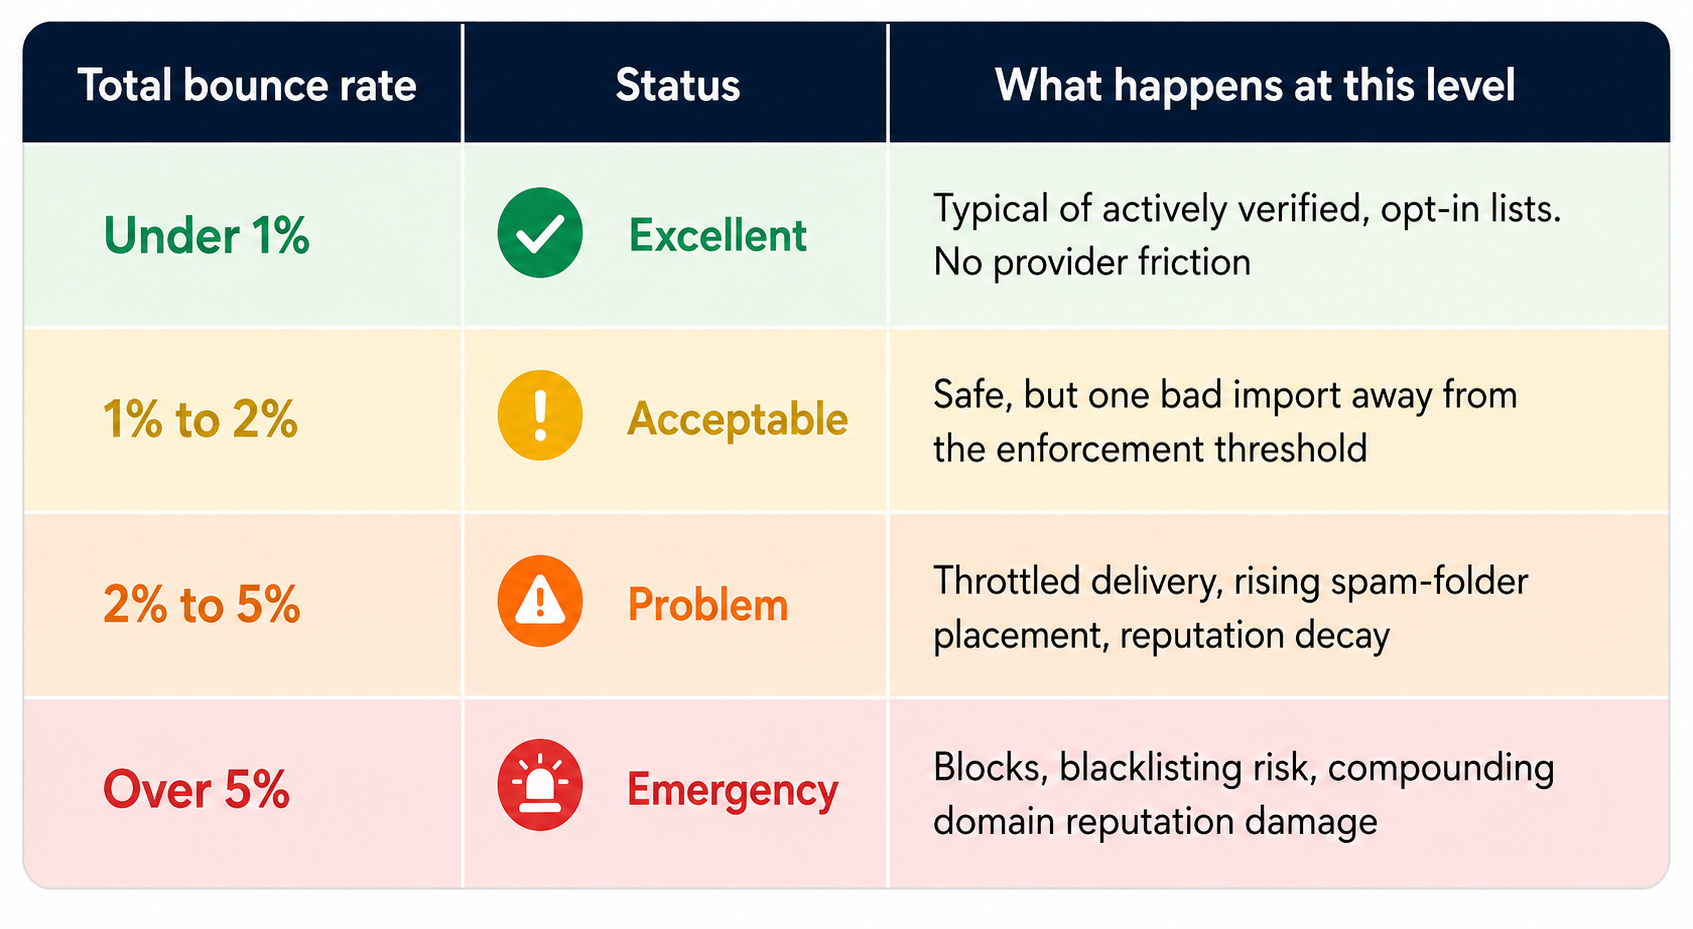
The short answer: keep total bounces under 2% and hard bounces under 1%. The 2% figure is the near-universal industry guidance, and the enforcement climate around it hardened sharply in 2025. Since November 2025, Gmail rejects mail from non-compliant bulk senders with permanent 550 errors at the server level rather than deferring or spam-foldering it, and Microsoft has applied equivalent enforcement to Outlook, Hotmail, and Live domains since May 2025 (rejection code 550 5.7.515). Google's codified thresholds target authentication and spam complaints rather than bounce rate directly, but the two are mechanically linked: hard bounces are one of the strongest poor-list-quality signals in a provider's reputation model, and senders whose hard bounces persistently exceed 2% are widely reported to face deferrals and domain-level blocking. Because providers score trends rather than single campaigns, recovery takes months even after the underlying list is fixed.
Here is the working scale most deliverability teams use in 2026:
Hard bounces vs soft bounces: they are not equal
A hard bounce (SMTP 5xx response, most commonly 550) is a permanent failure: the mailbox does not exist, the domain is dead, or the receiving server explicitly rejected your message. Hard bounces are the signal mailbox providers weigh most heavily, because a sender hitting many nonexistent addresses looks exactly like a sender using purchased or scraped data. Suppress hard bounces the same day they occur, and confirm your ESP's auto-suppression is actually switched on rather than assuming it.
A soft bounce (SMTP 4xx response) is temporary: a full mailbox, a server timeout, a message-size rejection. Your ESP retries these automatically and they carry less individual weight. But repeated soft bounces from the same address are hard bounces in disguise. If an address soft-bounces across three consecutive sends, remove it.
Bounce rate is also only one of the signal providers' scores. Google's official sender guidelines require keeping the user-reported spam rate below 0.1% and never letting it reach 0.3%, the point at which delivery impact becomes severe, and authentication (SPF, DKIM, DMARC) plus RFC 8058 one-click unsubscribe are now hard requirements for bulk senders rather than nice-to-haves. Together these inputs form your sender reputation, the score that ultimately decides whether a technically delivered email lands in the inbox or the spam folder.
Email deliverability benchmarks by industry (2026)
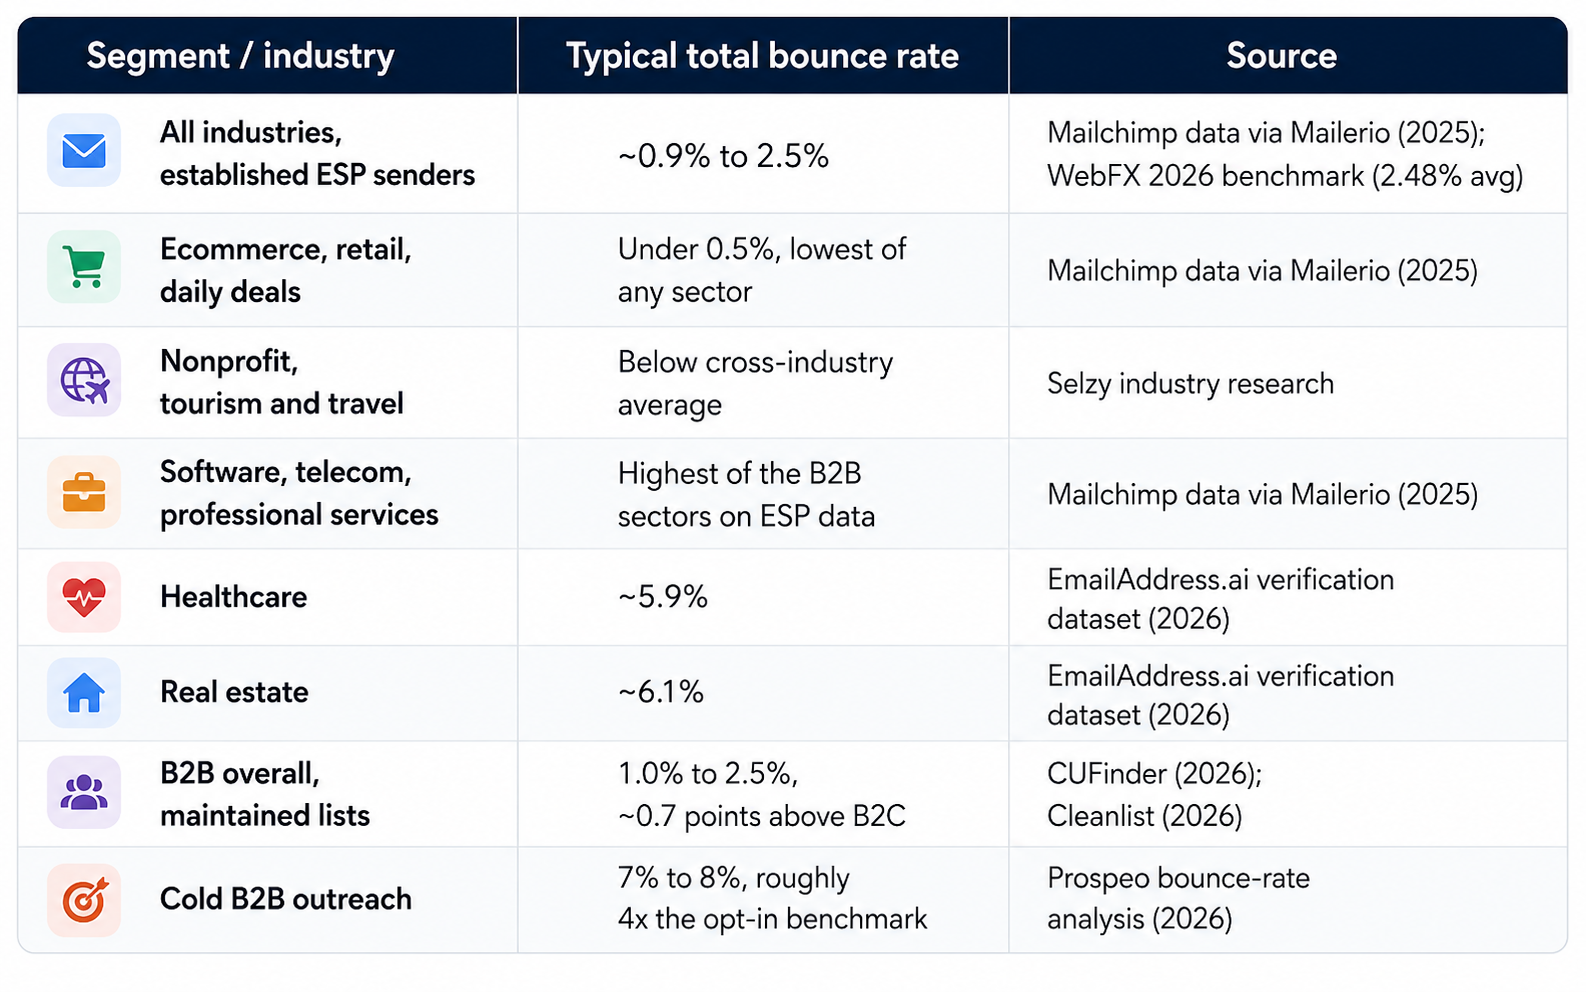
Published benchmark studies disagree with each other, sometimes by an order of magnitude, and the disagreement is almost entirely methodological. Datasets drawn from established ESP senders skew low, because platforms like Mailchimp and Brevo purge abusive senders and auto-suppress bounces, so their averages describe already-clean lists. Broader market studies that include cold outreach, legacy CRM exports, and purchased data skew far higher: Total Product Marketing's 2025 cross-industry analysis put the average bounce rate at 10.68%, while Selzy's industry research landed at 1.98% and Mailchimp's platform data (republished by Mailerio in 2025) shows just 0.21% hard and 0.70% soft bounces, roughly 0.9% total, across billions of sends.
Neither extreme is wrong. They measure different populations of senders, and knowing which population you belong to is the first step in benchmarking honestly. With that caveat stated, here is the consolidated 2026 picture:
What the industry spread actually tells you
Ecommerce sits at the bottom of the table because of acquisition mechanics, not marketing skill. Retail subscribers typically sign up at the point of a transaction, entering an address they actively use because a receipt or discount depends on it. The data is self-verifying at capture. Industries without that transactional moment inherit noisier data by default.
Healthcare and real estate sit at the top for the same two reasons: catch-all infrastructure and turnover. Both sectors run heavily on catch-all email domains, which accept mail for any address during the SMTP handshake and therefore defeat standard verification, and both churn contacts quickly. EmailAddress.ai's 2026 analysis attributes the sectors' elevated bounce rates directly to this combination. If you sell into these markets, a verifier's catch-all handling matters more than its headline accuracy claim. More on that below.
B2B runs structurally hotter than B2C because business data decays faster. B2B contact data degrades at roughly 22% to 25% per year as people change jobs, companies merge, and mail systems are migrated. A list verified twelve months ago is not a verified list; it has silently reaccumulated invalid addresses through no fault of yours. This is why re-verification cadence belongs in any benchmark discussion: quarterly for marketing lists is the floor, and high-volume outbound teams re-verify far more often. The economics of that cadence depend on your bulk email verifier making repeat runs fast and cheap enough to be routine rather than a quarterly project.
Cold outreach lives in a different benchmark universe. At 7% to 8% average bounces, unverified cold lists sit permanently in the range that providers treat as a spam signal, roughly 4x above the 2% safety line. Pre-send verification is not an optimization for cold email in 2026; it is the entry requirement for the channel to function at all.
The accuracy claim problem: what independent testing actually found
Only one large-scale, methodology-disclosed benchmark of email verifiers has been published: Hunter's test of 15 tools against 3,000 real business email addresses, released in November 2025 and updated in April 2026, with the raw results published as an open spreadsheet. Whatever you think of a vendor benchmarking its own category, the test's design is worth taking seriously, and its findings demolish the industry's 99% narrative.
How the test worked. Hunter assembled roughly 2,700 real addresses from recent outreach campaign activity, added 300 known-invalid addresses, and split the set into three segments by company size: small (1 to 50 employees), medium (51 to 200), and large (201+), each with about a 900/100 valid-to-invalid split. All 15 tools verified the identical lists in bulk through Clay's integrations under default settings. Accuracy was scored strictly: correct classifications divided by total addresses, with "unknown" and unresolved "accept-all" verdicts counting against the tool.
The results. Under that strict scoring, from Hunter's published benchmark:
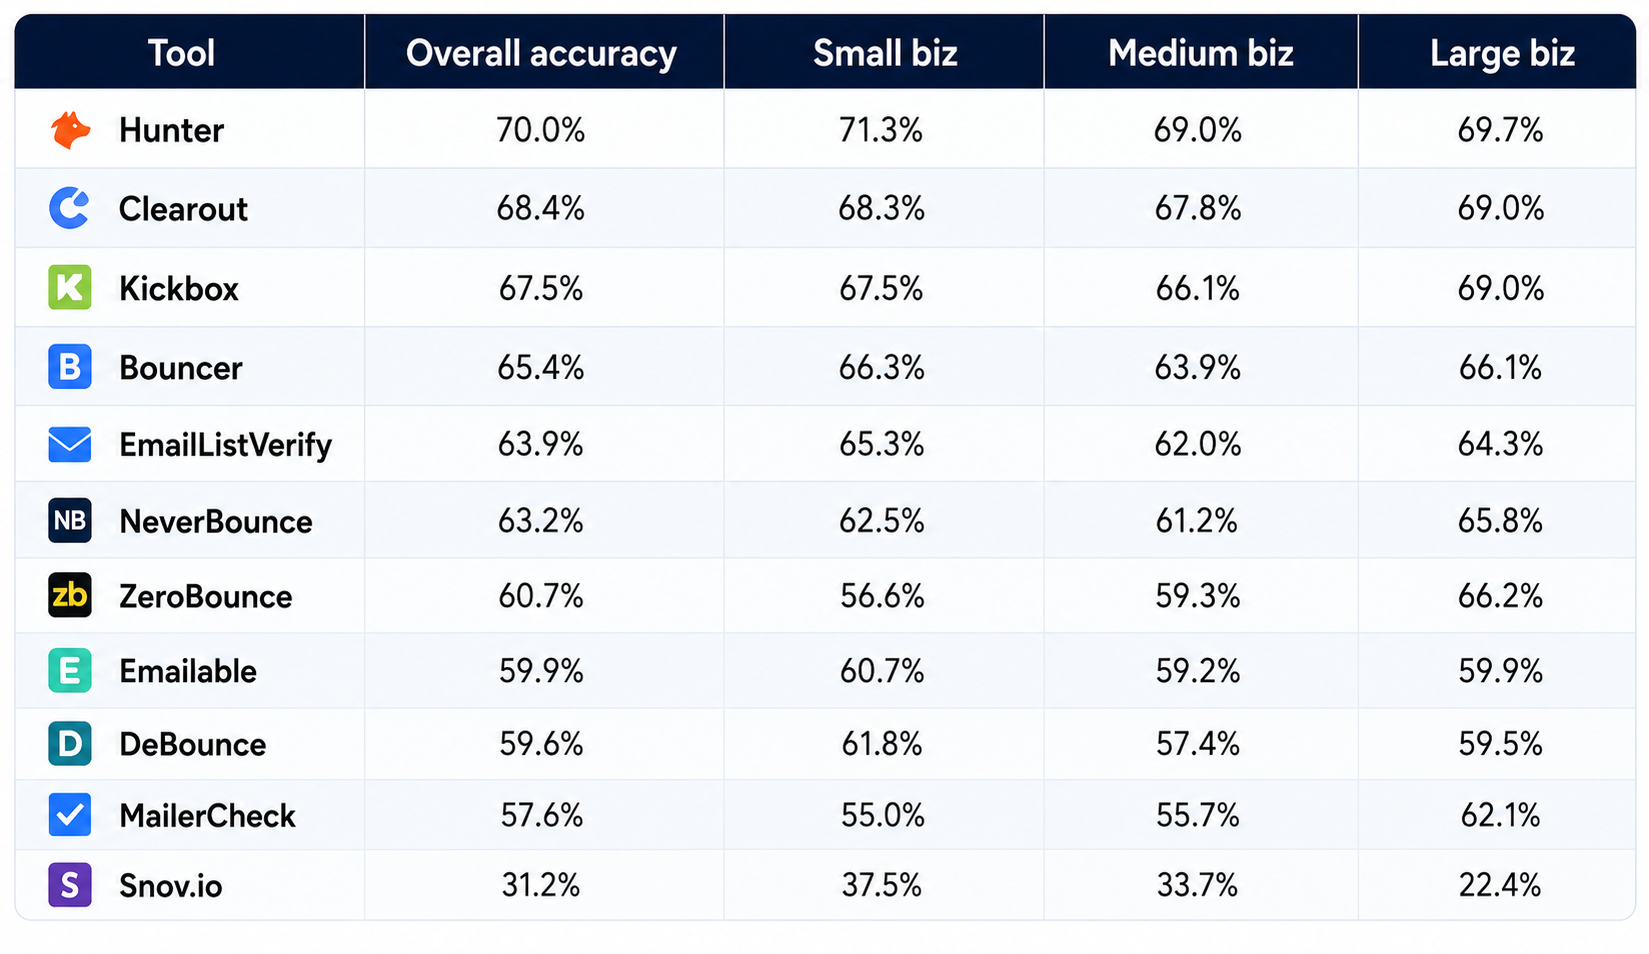
Source: Hunter, "15 Best Email Verification Tools in 2026," 3,000-address benchmark, published November 2025, updated April 2026. Four additional tools (Findymail, Enrichley, LeadMagic, Icypeas) scored between 41.8% and 52.9% overall. Raw data spreadsheet available via Hunter's guide.
What these numbers actually mean
No tool came close to its advertised accuracy. The field leader scored 70% under strict measurement, against homepage claims of 99% across the industry. The gap is not fraud so much as definition: vendor claims typically exclude unknowns and accept-alls from the calculation, which are precisely the addresses you needed an answer on. Hunter's scoring counted them as failures, which is the correct standard, because an "unknown" verdict does not stop a bounce.
The benchmark has a disclosed bias, and Hunter says so itself. Ground-truth validity labels came from email activity recorded on Hunter's own platform, and many tested addresses may have originated from Hunter's B2B database, which plausibly inflates Hunter's own first-place score. Crediting them for disclosing it, the practical takeaway is to treat the exact ranking of the top three or four tools as soft, and the pattern across the whole field as solid.
Accuracy collapses as company size grows. Every tool scored worse on enterprise domains than on small-business domains, some catastrophically: Snov.io fell to 22.4% on the 201+ employee segment, misclassifying roughly three of every four valid enterprise addresses. The cause is structural. Larger companies run custom mail servers, secure email gateways, internal relays, and above all catch-all configurations that reject or absorb standard SMTP verification attempts. The harder your list skews enterprise, the less any headline accuracy figure describes your reality.
A verifier's "unknown" rate is a hidden cost. Tools that scored poorly often did so by returning unknowns at scale rather than by guessing wrong. An unknown verdict costs you either way: send anyway and risk the bounce, or discard the address and lose the prospect. When you compare vendors, ask what share of a realistic B2B list comes back actionable, not just what share of the answered addresses was correct.
Where No2Bounce stands in this data: it doesn't, yet. No2Bounce was not among the 15 tools in Hunter's benchmark, so we will not invent a score for ourselves, and you should be suspicious of any vendor who quotes a benchmark it does not appear in. What we will do is state the standard plainly: strict scoring, unknowns counted as failures, enterprise-heavy data included, results published with the methodology. We are running No2Bounce against that standard and will publish the results on this blog, including the addresses we get wrong. Until then, the free credits below let you run the only benchmark that matters more than any published table: your own list.
Catch-all detection: the segment where every verifier is really being tested
The enterprise accuracy collapse in Hunter's data has one dominant cause, and it deserves its own section because it is the single biggest variable in whether verification works on business data at all.
A catch-all (accept-all) domain is configured to accept mail for any address at the SMTP handshake, real mailbox or not. The standard verification technique, pinging the mail server and reading its response, therefore returns "deliverable" for every address on the domain, including ones that will hard-bounce the moment you actually send. A verifier without dedicated catch-all resolution has two honest options: label the address "risky" and hand the decision back to you, or guess.
The scale of the problem is what makes it decisive:
- Catch-all addresses make up an estimated 23% to 31% of typical B2B databases (EmailAddress.ai, 2026).
- They cluster in exactly the industries with the worst bounce benchmarks: healthcare, real estate, enterprise, education.
- In Hunter's benchmark, the large-business segment, where catch-all and gateway configurations dominate, produced the worst scores for every tool tested, with even the top performers dropping to around 69% and the weakest to 22%.
Put those together and the conclusion is blunt: a tool that is 99% accurate on easy addresses but punts on catch-alls is not 99% accurate on your data. On a typical B2B list it is leaving roughly a quarter of your addresses unresolved, and on a healthcare or real estate list, considerably more.
Resolving catch-alls, returning a definitive valid or invalid verdict on accept-all domains instead of a shrug, is the specific engineering problem No2Bounce's catch-all email verifier was built around, using multi-signal analysis of the domain's mail infrastructure rather than relying on the SMTP handshake alone. The honest way to evaluate that claim is the same way you should evaluate anyone's: run a sample of your own catch-all-heavy addresses through it and compare the verdicts against your bounce logs.
How to use these benchmarks before you buy
Diagnose your bounce profile first. Pull your last three campaigns and split bounces into hard and soft. If hard bounces exceed 1%, your problem is list quality and verification is the fix. If soft bounces dominate, look at sending volume, warm-up, and infrastructure before spending on verification, because a cleaning tool cannot solve a throttling problem.
Benchmark against your segment, not the global average. A 1.5% bounce rate is respectable for cold B2B outreach and alarming for an opt-in ecommerce list. Use the industry table above, and remember which population each source describes.
Discount headline accuracy claims by default. The only strict independent measurement on record puts the entire field between 31% and 70%. Any vendor quoting 98% or 99% without a disclosed dataset, a disclosed definition of accuracy, and a disclosed treatment of unknowns is quoting marketing, not measurement.
Weight catch-all resolution by your list composition. Run a free sample of your list through any verifier and check what percentage comes back "accept-all," "risky," or "unknown." If it is over 15%, catch-all handling will predict your real-world bounce rate better than any headline accuracy figure does.
Verify on a schedule, not once. With B2B data decaying at over 20% a year, a one-off clean is a snapshot. Quarterly re-verification for marketing lists, and pre-send verification for outbound, is what keeps you under the 2% enforcement line permanently.
FAQ
How is email verification accuracy measured?
Email verification accuracy is the percentage of addresses a tool classifies correctly against known-true outcomes. A rigorous measurement requires a ground-truth dataset whose valid/invalid status is independently confirmed, a disclosed rule for how "unknown" and "accept-all" verdicts are counted, and a stated test date. Under strict scoring, where unknowns count as failures, the best independently tested verifier scored 70% and the field ranged down to 31%, far below the 99% figures vendors advertise.
What does "catch-all" mean in email verification results?
A catch-all (or accept-all) result means the address belongs to a domain whose mail server accepts messages for every possible address, whether or not the mailbox exists. Standard SMTP verification cannot tell a real mailbox from a fake one on these domains, so many tools label them "risky" or "unknown." Catch-all addresses make up roughly a quarter to a third of typical B2B lists, so how a verifier resolves them largely determines its usefulness on business data.
What is a good email bounce rate in 2026?
Under 2% total and under 1% hard bounces. Since late 2025, both Gmail and Microsoft hard-reject mail from non-compliant senders rather than deferring it, and persistent hard bounces above 2% are one of the strongest signals that triggers reputation damage and blocking. Well-maintained opt-in lists on major ESPs average around 0.9% total bounces, so treat under 1% as the standard your list is competing against.
Why do email verifiers score so much lower in independent tests than they advertise?
Because vendor claims and independent tests measure different things. Marketing figures typically describe accuracy on the addresses a tool chose to classify, excluding the unknowns and accept-alls it declined to answer. Independent testing counts those non-answers as failures, since they do not prevent bounces, and includes hard cases like enterprise and catch-all domains. On that stricter, more realistic standard, measured accuracy across 15 tools ranged from 31% to 70% in Hunter's 2026 benchmark.
How often should I verify my email list?
Quarterly at minimum for opt-in marketing lists, and before every send for cold outreach. B2B contact data decays at roughly 22% to 25% per year as people change roles and companies restructure, so a list verified more than a few months ago has already reaccumulated invalid addresses. Adding real-time verification at the point of capture stops most bad data from entering your CRM in the first place.
Test it on your own list
Published benchmarks tell you how tools performed on someone else's dataset. The only number that ultimately matters is what a verifier does on yours. No2Bounce includes free verification credits on signup, enough to run a sample of your actual list, catch-all addresses included, and compare the verdicts against your own bounce logs. If the results hold up, scale from there.
Start cleaning your list instantly.
No credit card required.